
Sludge dewatering is no longer a minor step behind the treatment plant. It directly affects hauling costs, disposal volume, energy use, and the reliability of wastewater operations. According to the UN-Water SDG 6 Synthesis Report 2023, 42% of household wastewater worldwide was not safely treated in 2022. This gap creates sustained demand for efficient sludge management and dependable dewatering systems.
The Water Environment Federation’s Manual of Practice No. 8 identifies centrifuges, belt filter presses, and screw presses as established technologies for reducing sludge volume. Each option behaves differently beside a real clarifier. A centrifuge may deliver consistent cake dryness, while a belt press can offer simpler visual monitoring. Screw presses often attract smaller facilities because of their lower operating complexity. The European Commission’s Best Available Techniques Reference Document for Waste Treatment also emphasizes energy use, emissions control, maintenance, and process optimization.
The stakes are practical. A few percentage points of solids content can change truck frequency and disposal expense. Yet, manufacturer rankings should not rely on product brochures alone. This guide evaluates Top Sludge Dewatering Equipment Manufacturers Worldwide through equipment performance, application experience, service coverage, automation, lifecycle cost, and documented customer results. Data remains uneven. Some suppliers publish detailed test results, while others provide limited field evidence. That limitation deserves attention, because laboratory performance can differ sharply from sludge containing grit, grease, or seasonal industrial loads. The most credible manufacturers therefore combine proven machinery with pilot testing, responsive technical support, and transparent operating data. This comparison aims to help engineers, contractors, and plant owners make decisions grounded in measurable performance rather than market visibility alone.
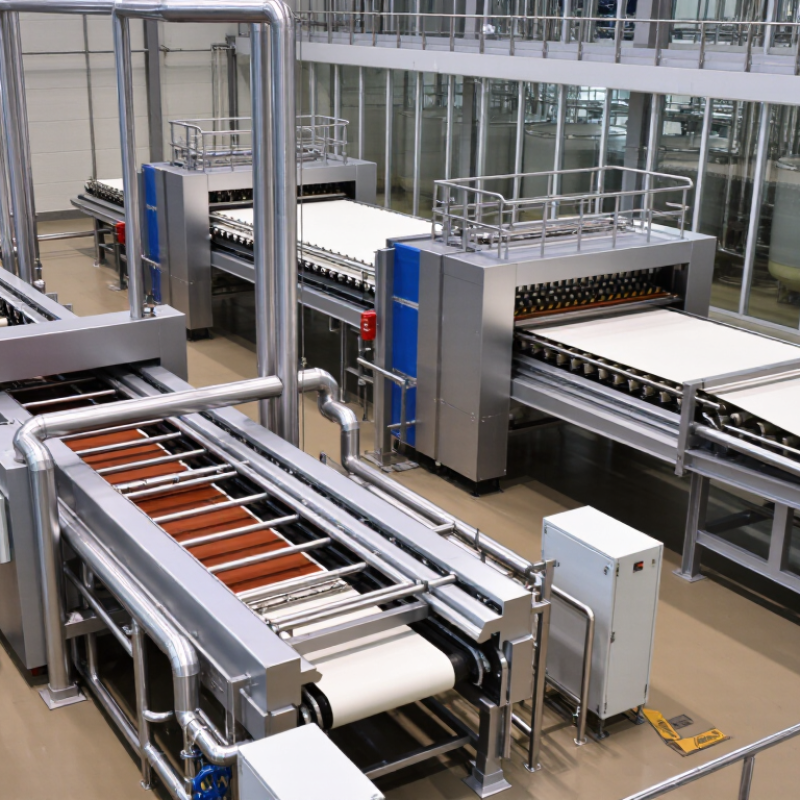
Top Sludge Dewatering Equipment Manufacturers Worldwide
Sludge dewatering removes free water before hauling, drying, or beneficial reuse. It lowers volume, storage demand, and transport frequency. U.S. Environmental Protection Agency process guidance commonly reports feed sludge at 1–4% solids and dewatered cake at roughly 15–30%. Actual results depend on polymer selection, temperature, and sludge age.
The operating principle is simple. Mechanical force separates water from concentrated solids. Belt filter presses use gravity drainage and compression. Screw presses apply gradual pressure through a rotating shaft. Centrifuges generate high centrifugal force inside a bowl. Filter presses use repeated pressure cycles and can produce drier cakes, but they usually require more labor and batch handling.
The choice should match the sludge, not the brochure. Municipal waste activated sludge often needs careful conditioning before pressing. Industrial sludge may contain abrasive minerals or unusual chemicals. The United Nations World Water Development Report has estimated that more than 80% of global wastewater is discharged without adequate treatment, increasing pressure on treatment capacity. That figure does not determine equipment demand directly, but it shows the scale of the problem.
Field experience remains important. A clean pilot test can mislead. Seasonal sludge changes may reduce capture rates, while excessive polymer can raise operating costs and complicate reuse. Engineers should compare solids capture, cake dryness, power use, wash-water demand, noise, and maintenance access. The best system is rarely the driest one. Reliability matters more than impressive laboratory numbers.

When comparing global sludge dewatering equipment manufacturers, capacity is only one part of the decision. The United Nations World Water Development Report 2017 states that over 80% of wastewater is discharged without treatment worldwide. This pressure makes dependable dewatering increasingly important. Compare tested throughput, cake solids, solids capture, polymer demand, power use, and wash-water consumption. EPA technology fact sheets commonly report belt filter press cake solids around 12–25%, with capture rates often above 95%. Actual results vary with sludge type.
Look beyond brochures. Ask manufacturers for pilot-test records using your sludge, not laboratory substitutes. Request energy data in kWh per dry tonne and polymer dosage in kilograms per dry tonne. Check whether the quoted capacity includes peak loading, rainy-season dilution, and operator adjustments. Service coverage matters too. A strong supplier should provide commissioning support, spare-part availability, safety documentation, and operator training across your region. Standards compliance helps, but it does not replace field evidence.
Tips: Build a weighted comparison table. Give performance 35%, lifecycle cost 25%, service 20%, and compliance 20%. Visit at least one operating installation. Small details matter, such as belt access, noise, odor control, and cleaning time. Be skeptical of perfect numbers. Sludge changes daily, and a “best” machine may perform poorly with high grease, ferric salts, or variable solids. One weakness remains: many published case studies omit long-term maintenance costs, so buyers should verify those figures independently.
Evidence-based comparison criteria and commonly used industry reference ranges
| Comparison Dimension | What to Compare | Typical Industry Reference or Requirement | Why It Matters |
|---|---|---|---|
| Equipment Technology | Screw press, belt filter press, decanter centrifuge, or recessed-chamber filter press | Technology selection should match sludge type, required cake dryness, operating hours, available space, and automation level | The dewatering principle directly affects cake solids, polymer demand, energy use, noise, and maintenance |
| Feed Solids Concentration | Design feed total solids and variability | Municipal waste activated sludge is commonly around 0.5–3% total solids before thickening; actual values vary by process and site | Feed concentration influences hydraulic loading, polymer consumption, and equipment throughput |
| Expected Cake Solids | Dry-solids percentage in the dewatered cake | Indicative ranges: screw press 15–25%; belt filter press 15–30%; centrifuge 18–30%; filter press 30–45%, depending on sludge and conditioning | Higher cake solids can reduce hauling, storage, and disposal volumes |
| Solids Capture | Percentage of feed solids retained in the cake | Well-conditioned systems commonly target approximately 90–99% solids capture; performance depends on sludge characteristics and polymer control | Higher capture reduces solids loss to the filtrate or centrate and lowers downstream treatment load |
| Polymer Conditioning | Polymer type, dosing control, mixing quality, and testing procedure | A commonly reported starting range is about 2–10 kg of active polymer per tonne of dry solids, subject to jar testing and full-scale optimization | Correct conditioning improves cake dryness, filtrate clarity, throughput, and chemical cost control |
| Capacity Rating | Hydraulic capacity and dry-solids throughput | Capacity should be stated separately in m³/h and tonnes of dry solids per day, with design, average, and peak conditions identified | Hydraulic capacity alone can overstate practical performance when feed solids concentration changes |
| Energy Consumption | Specific electricity use per cubic metre and per tonne of dry solids | Compare measured energy at the same feed solids, cake-solids target, throughput, and operating duty; centrifuges generally require more electrical power than passive or low-speed systems | Energy data supports accurate lifecycle-cost and carbon-footprint calculations |
| Water and Wash Requirements | Cleaning-water flow, frequency, and water quality requirements | Belt-based systems generally require continuous or frequent belt washing; screw presses typically use less wash water, while requirements vary by configuration | Water demand affects plant hydraulics, operating cost, and filtrate or centrate treatment load |
| Automation and Controls | Automatic polymer adjustment, torque or vibration monitoring, overload protection, alarms, and remote access | Preferred systems provide PLC-based control, variable-speed drives, interlocks, trend logging, and integration with common industrial communication protocols | Automation improves consistency, operator safety, uptime, and troubleshooting |
| Materials and Corrosion Protection | Wetted-part metallurgy, protective coatings, elastomers, and fastener materials | Stainless steel grades such as 304 or 316 are commonly considered for corrosion-prone components; the correct selection depends on chloride, sulfide, and chemical exposure | Appropriate materials extend service life and reduce corrosion-related failures |
| Safety and Enclosure Protection | Guarding, emergency stops, electrical protection, access control, and ingress protection | Electrical and machinery design should comply with applicable local regulations; IP55 is a common minimum reference for protected industrial electrical enclosures | Safety compliance protects personnel and reduces operational and regulatory risk |
| Quality and Environmental Systems | Documented quality control, environmental management, testing, and traceability | ISO 9001 is widely used for quality-management systems, while ISO 14001 is widely used for environmental-management systems | Certified management systems provide a structured basis for consistent production and environmental control |
| Testing and Acceptance | Pilot testing, factory acceptance testing, site acceptance testing, and performance guarantees | Performance tests should use representative sludge and record feed rate, feed solids, polymer dose, cake solids, capture rate, filtrate quality, and power | Comparable test conditions prevent unrealistic claims and support reliable procurement decisions |
| Maintenance and Wear Parts | Inspection intervals, wear-part lifespan, spare-parts availability, and service response | Evaluate preventive-maintenance schedules and replacement intervals under the actual sludge abrasiveness and operating hours | Maintenance access and parts availability strongly influence total cost of ownership and uptime |
| Lifecycle Cost | Purchase price, installation, civil works, polymer, electricity, wash water, labor, maintenance, and disposal | Use a multi-year total-cost model based on dry-solids throughput and disposal volume rather than equipment price alone | Lifecycle analysis provides a more reliable comparison between different dewatering technologies and suppliers |
Regional manufacturers shape sludge dewatering equipment around local wastewater conditions, regulations, and operating budgets. Europe remains a mature market, supported by strict discharge controls and established municipal treatment networks. Manufacturers there often emphasize low-energy centrifuges, belt presses, and automated polymer dosing. North American suppliers focus on large-scale municipal plants, remote monitoring, and compliance documentation. The United States Environmental Protection Agency reports that biosolids management depends heavily on reliable solids capture and consistent process control.
Asia-Pacific shows stronger expansion potential. Grand View Research estimates that the global sludge dewatering equipment market will grow steadily through 2030, with Asia-Pacific among the fastest-growing regions. Rapid urbanization is increasing sludge volumes in China, India, Southeast Asia, and other developing markets. Local manufacturers often design compact screw presses for smaller sites. Maintenance access matters. Very much.
In the Middle East, water scarcity encourages advanced wastewater reuse and tighter sludge handling. Equipment manufacturers must manage high salinity, dust, and irregular influent loads. Latin American producers commonly serve food-processing, mining, and municipal applications, where feed composition can change sharply. MarketsandMarkets identifies wastewater treatment investment as a major infrastructure trend across emerging economies, although regional forecasts differ. That uncertainty deserves attention. Buyers should compare polymer consumption, kilograms of water removed per hour, energy use, corrosion resistance, and nearby technical support. A low purchase price can become expensive when spare parts arrive slowly. Local testing is still the most reliable selection method.
Leading Sludge Dewatering Equipment Manufacturers by Region
This regional comparison uses urban population as a demand indicator for municipal wastewater and sludge treatment infrastructure. East Asia and the Pacific represent the largest potential demand base, followed by South Asia, Europe and Central Asia, and Latin America and the Caribbean. The chart does not rank individual companies or brands.
Data basis: 2023 estimated urban population by World Bank regional classification, rounded to the nearest million.
Leading sludge dewatering equipment manufacturers now compete on measurable performance, not catalog size. Product capability starts with solids capture, polymer control, throughput, and cake dryness. These variables determine hauling costs and downstream handling.
The U.S. Environmental Protection Agency’s national biosolids assessment estimated about 7.2 million dry tons were generated annually in the United States. That figure explains why small efficiency gains matter.
Decanter centrifuges suit continuous plants, while belt presses often offer simpler operation and lower energy demand.
Filter presses can produce drier cakes, but batch cycles require space and disciplined labor.
None wins everywhere.
Innovation is becoming more practical. Manufacturers integrate inline sensors, automated polymer dosing, variable-speed drives, and remote condition monitoring. These tools stabilize feed changes, especially when municipal sludge arrives after heavy rain.
Global Water Intelligence’s 2024 market analysis highlights digital control and resource recovery as recurring investment themes. UN-Water’s 2024 World Water Development Report places agriculture at roughly 70% of global freshwater withdrawals.
That pressure expands applications beyond wastewater plants. Food processing, mining, and industrial facilities need different screen sizes, corrosion resistance, and cake specifications. Field trials should test real sludge, seasonal polymer demand, and actual cake transport costs.
Labor savings are often promised. Yet published trials may use ideal feed conditions. Buyers should question averages, request mass-balance data, and compare performance over several weeks. Perfect dryness is not always the best result.
Selecting the right sludge dewatering equipment manufacturer requires more than comparing catalogue capacity. Start with your sludge, not the machine. Record moisture content, particle size, polymer demand, temperature, and daily volume. A supplier should request these details before recommending a model. That question matters. Experienced manufacturers explain how changing feed conditions affect cake dryness, filtrate quality, energy use, and operator workload. Ask for test data using sludge similar to yours, not generic laboratory samples.
Review the manufacturer’s engineering depth. Can its team size pumps, conveyors, dosing systems, controls, and ventilation as one process? Check drawings, commissioning procedures, maintenance intervals, and spare-parts availability. Visit an operating installation when possible. Look at the cake discharge area. Is it clean, stable, and easy to access? Speak with operators, because brochures rarely describe blocked lines or noisy drives. Independent certifications, documented performance, and clear warranty terms also strengthen reliability.
Request a total-cost estimate covering power, polymers, wash water, labor, wear parts, and disposal. A low purchase price may hide expensive daily inputs. Compare results under peak and average loading, then define acceptance tests in writing. Be cautious with promises of exceptional dryness. Results vary. We sometimes overvalue technical specifications and undervalue local service response. That judgment deserves review. Select a manufacturer willing to disclose limitations, adapt the design, and support operators after installation. Good equipment is useful; dependable process support is better.


All of Hapco's formulations are completely free of Mercury.

Hapco has been in business for over 50 years!

*NOTICE* Hapco will be will be closed on Monday, May 26th, in observance of Memorial Day. |
| Cookie | Duration | Description |
|---|---|---|
| cookielawinfo-checkbox-analytics | 11 months | This cookie is set by GDPR Cookie Consent plugin. The cookie is used to store the user consent for the cookies in the category "Analytics". |
| cookielawinfo-checkbox-functional | 11 months | The cookie is set by GDPR cookie consent to record the user consent for the cookies in the category "Functional". |
| cookielawinfo-checkbox-necessary | 11 months | This cookie is set by GDPR Cookie Consent plugin. The cookies is used to store the user consent for the cookies in the category "Necessary". |
| cookielawinfo-checkbox-others | 11 months | This cookie is set by GDPR Cookie Consent plugin. The cookie is used to store the user consent for the cookies in the category "Other. |
| cookielawinfo-checkbox-performance | 11 months | This cookie is set by GDPR Cookie Consent plugin. The cookie is used to store the user consent for the cookies in the category "Performance". |
| viewed_cookie_policy | 11 months | The cookie is set by the GDPR Cookie Consent plugin and is used to store whether or not user has consented to the use of cookies. It does not store any personal data. |